
A DEI program is measurable only when its data shows whether the intended workplace experience or opportunity gap is changing. Training completions, ERG headcounts, and event attendance fill a slide deck without showing whether anyone’s experience of the organization changed. Measuring well means choosing a short list of outcome metrics, segmenting them properly, and reviewing them on a cadence that forces real decisions.
This guide explains how to measure the success of a DEI program: define the outcome you want to change, establish a baseline, track representation and lived experience, protect sensitive data, assign metric owners, and connect every result to a documented action.
I have a DEI team. And we know we need to stay in this world. But how do I know if I am doing the right things? What the hell do I measure?Read on Reddit ↗
Define What DEI Success Should Change
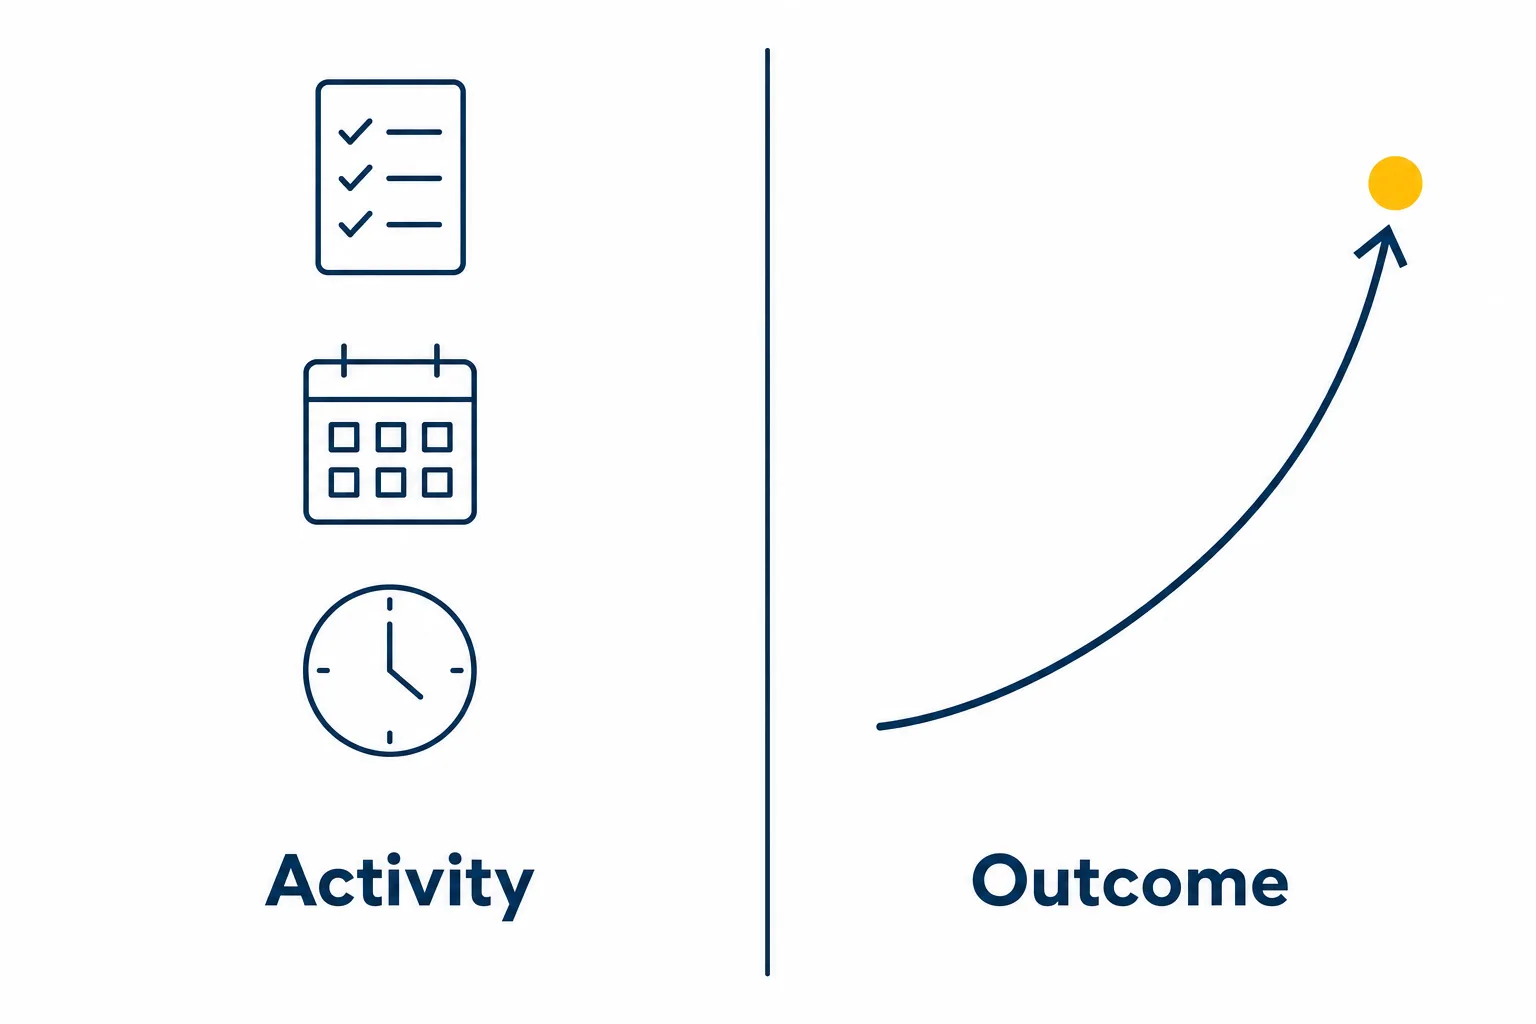
Name the outcome the program was funded to change. Closing a promotion gap is a different program, with different metrics, than reducing early attrition among new hires or fixing an adjusted pay gap.
Separate two categories that often get blurred:
- Activity metrics count effort: training hours delivered, ERG events held, job boards used.
- Outcome metrics count change: attrition gap narrowed, promotion rate parity, offer acceptance rates by group.
Activity metrics help you manage the work. They are not evidence of impact.
Write goal statements containing a number, a population, and a date. “Reduce the gap in voluntary attrition between Black employees and the company average from X points to Y points by the end of FY27” is measurable. “Build a more inclusive culture” is not.
Then pull your baseline. Gather current-state data before anything launches, or you will never be able to attribute change to the program. For each metric, name the decision it will inform. A metric should inform a defined decision, such as a policy change, resource allocation, or manager action.
Build a DEI Scorecard Before You Collect More Data
A scorecard keeps the measurement system connected to the program’s purpose. Start with a small set of metrics, define each one, and record who will review it and what action follows a material change.
| Objective | Example metric and calculation | Decision or action |
|---|---|---|
| Representation | Employees in a group ÷ total employees × 100, reported by level and function | Review recruitment, retention, advancement, or workforce-planning barriers |
| Hiring equity | Candidates from a group advancing to the next stage ÷ candidates from that group entering the stage × 100 | Review the stage where selection rates diverge |
| Promotion equity | Employees in a group promoted ÷ eligible employees in that group × 100 | Review promotion criteria, sponsorship, and access to visible work |
| Retention | Voluntary attrition rate for a group − comparison-group attrition rate | Investigate exit themes, management practices, workload, and progression |
| Pay equity | A clearly defined mean or median pay comparison, with the method and population documented | Review pay-setting practices and role or level differences |
| Inclusion | Reference-group inclusion score − focal-group inclusion score | Use listening and manager action planning to investigate the gap |
| Accessibility | Median time from an accommodation request to implementation, where the process allows this to be measured safely | Review the accommodation process and remove operational delays |
Do not copy targets from another organization. Set the baseline, target date, owner, reporting cadence, privacy rule, and action threshold for each metric. For additional inclusion and accessibility materials, see the Foundation’s resources for inclusion and accessibility.
Measure Across the Whole Employee Lifecycle
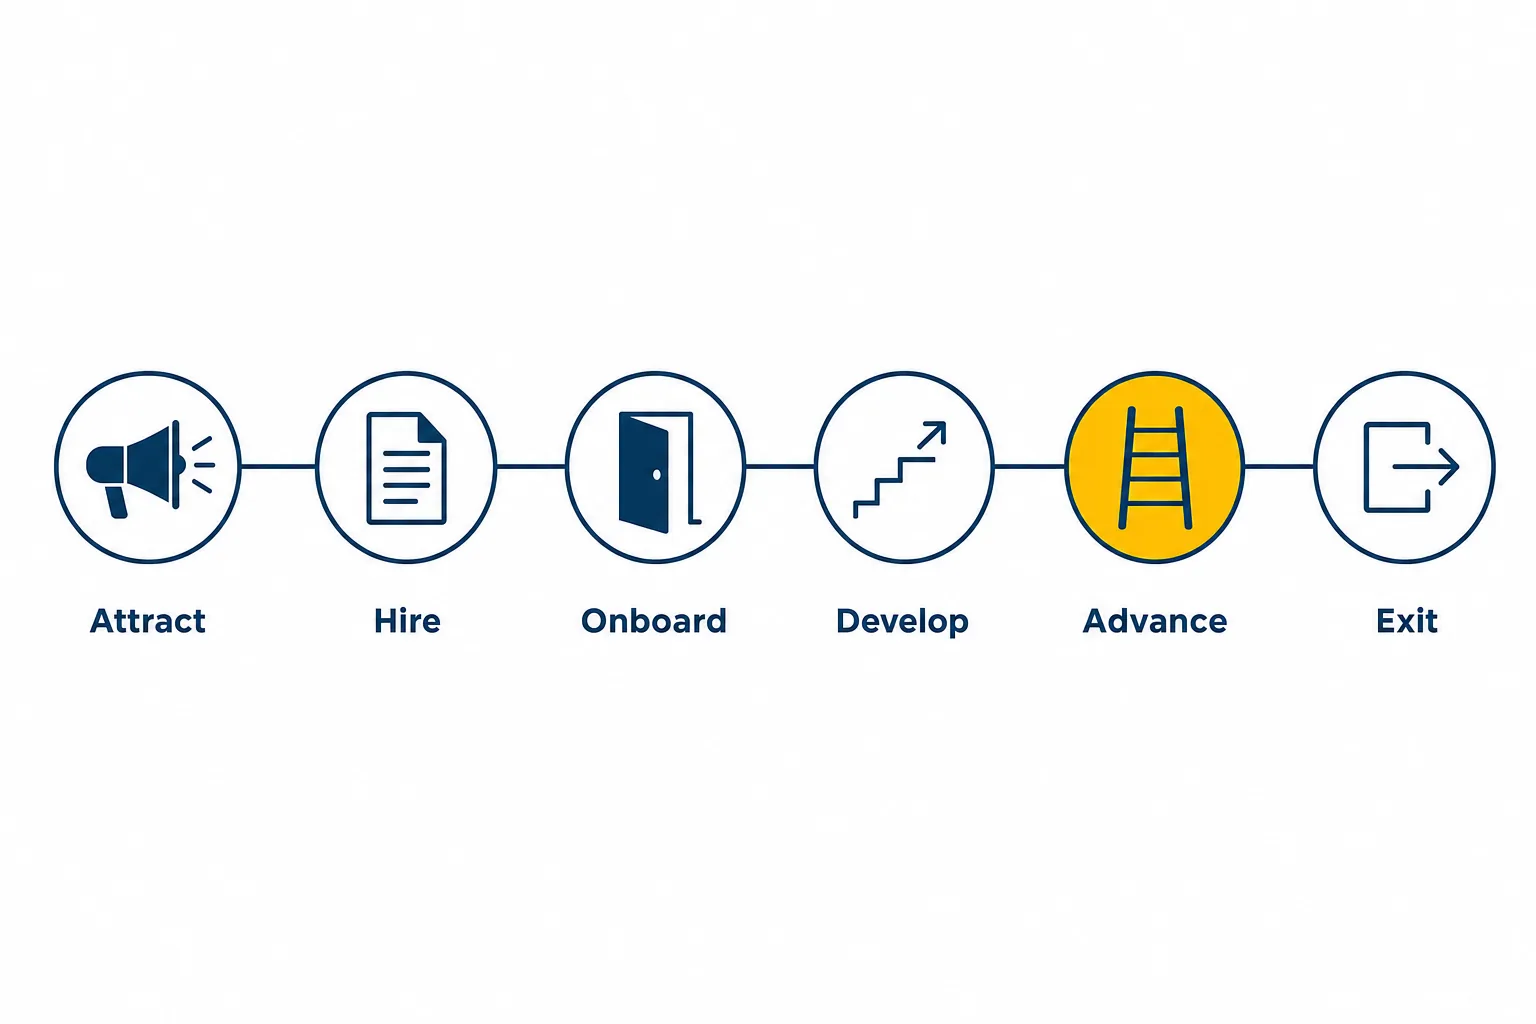
Instrument six stages: attraction, hiring, onboarding, development, advancement, and exit. Give each stage one quantitative indicator and one qualitative signal, so you know both what happened and how it felt.
Segment metrics where the sample size and privacy safeguards allow it. Company-wide averages hide the gaps that matter. Cut every metric by demographic group, level, function, tenure, and location. Also review intersections, such as disability and gender or race and job level, when the data is sufficiently reliable and protected. A large belonging gap in a single business unit can remain hidden inside a healthy organization-wide average.
Accessibility and disability inclusion belong in the frame from the start, not as an afterthought at the end of the survey. Accommodation request volume, approval rate, and fulfillment time are measurable, and so is the accessibility of the digital tools and physical spaces people are expected to use. The Victor Pineda Foundation places this accessibility lens within its disability-justice approach; a program that never measures whether the workplace is usable is not measuring inclusion in practice
Related readingHow to Start a Disability Inclusion ProgramRead the guide →A program that never measures whether the workplace is usable is not measuring inclusion in practice.
Quantitative DEI Metrics for a DEI Scorecard

Representation by tier. Track entry, manager, director, executive, and board separately, and read it as a pipeline rather than a headcount. Entry-level representation without comparable representation in management may indicate barriers in retention, advancement, or sponsorship.
Hiring funnel. Applicant pool composition, screening pass-through rates, interview-to-offer conversion by group, offer acceptance rates, and interview panel composition. Conversion rates show where in the funnel candidates are lost. Where this analysis is relevant to the jurisdiction, review selection rates and potential adverse impact with qualified counsel; U.S. employers can consult the EEOC’s Uniform Guidelines Q&A.
Retention and turnover. Compare voluntary attrition across groups. The gap is the signal; the absolute number is context. Consider separating regretted attrition when your organization defines and measures it consistently.
Promotion and advancement. Promotion rate, average time in level, and access to stretch assignments, sponsorship, and mentoring. Advancement gaps show up in access to visible work long before they show up in titles.
Pay equity. Run both analyses. The unadjusted gap compares all employees and mostly reveals representation problems: who sits in which roles. The adjusted gap controls for selected factors such as role, level, tenure, and location, and may help identify differences not explained by those factors for comparable work. Reporting only one of the two will mislead someone.
Access metrics people forget. Accommodation approval rates and turnaround times, flexible work approvals by manager, and how the training budget is actually distributed.
Incident and complaint data. Report volume, time to resolution, and repeat-respondent patterns. Read rising reports carefully: an increase can mean growing trust in the process rather than growing harm. Interpret it alongside survey data, never alone.
Measure Disability Inclusion as Part of DEI
Disability inclusion should be measured as access, participation, opportunity, and experience, not only as the number of employees who disclose a disability. A practical disability-inclusion view can include accommodation request volume, time to fulfillment, accessibility barriers identified and resolved, access to digital tools and physical workplaces, retention and promotion patterns, and inclusion-survey results.
Disclosure data requires particular care. A low disclosure rate may reflect privacy concerns, fear of stigma, unclear definitions, or a process employees do not trust; it should not be treated as a direct measure of the number of disabled people in an organization. Explain what is collected, why it is collected, who can access it, and how results will be protected before asking employees to self-identify.
Review disability data alongside other dimensions when the sample permits, while applying suppression rules that prevent re-identification. For example, a disability-related promotion gap may be concentrated in one level or function rather than appearing in the organization-wide result. The International Labour Organization’s disability-inclusion guidance and ILOSTAT guidance on disability-disaggregated labour data provide useful context for responsible measurement.
Qualitative Metrics: Belonging and Lived Experience
Quantitative data shows the pattern; qualitative evidence helps explain the conditions behind it.
Use an inclusion survey with clearly defined constructs, stable wording, and a documented scoring method. Questions may cover fairness, voice, belonging, psychological safety, respect, and access to decisions. The CIPD equality, diversity and inclusion factsheet provides broader workplace EDI context. Whichever instrument you use, keep the wording stable year over year so the trend line means something. Again, look at gaps rather than averages: the distance between how the majority group scores an item and how underrepresented groups score it is the finding.
Other sources worth systematizing:
- Stay and exit interviews, coded for recurring themes rather than read as anecdotes.
- Focus groups and ERG listening sessions, with a stated feedback loop to participants.
- Performance review audits, checking both the ratings distribution and the language of written reviews, by group, for patterns of bias.
Protect confidentiality throughout. Set a privacy suppression threshold with appropriate legal or privacy advice rather than applying one universal number to every organization.
Connecting DEI Metrics to Business and Mission Outcomes
Leadership funds what connects to outcomes they already track. Where relevant, connect inclusion scores to regretted attrition cost, time to fill, engagement, or the experience of clients, participants, or beneficiaries. Modeling the cost of a turnover gap, using your own replacement cost per role, can help leadership understand the operational implications without proving that a DEI intervention caused the result.
Be disciplined about causation. Most available evidence in this field is correlational. If you want to claim a program caused a change, design for it: pilot in some units, compare against similar units, and keep the comparison honest.
For nonprofits and advocacy organizations, keep staff metrics separate from a mission-measurement layer. That layer might examine who programs reach, board and staff composition, partner and grantee diversity, and the accessibility of services and events
Use Benchmarks as Context, Not a Standalone Score
Industry benchmarks and labor market availability data give context to raw representation numbers. A representation rate should be read against the relevant labor market, role requirements, geography, and organizational structure rather than in isolation.
Third-party inclusion indexes and DEI scores are directional signals, not verdicts. Benchmark against your own baseline first, then use matched external comparisons carefully to identify questions worth investigating. A public score should support an improvement plan, not replace employee-experience data.
Collect DEI Data With Privacy Safeguards
Incomplete data is the most common reason DEI dashboards stall. Run a voluntary self-identification campaign and explain plainly what is collected, how it is stored, who sees it, and what it will be used for.
Report response rates and disclosure rates beside demographic metrics; missing data can change the denominator and distort year-over-year comparisons.
Check jurisdictional limits before you collect. Rules on gathering racial, ethnic, health, and sexual orientation data vary by country, and multinational employers should get legal review before extending a self-ID campaign across borders. Aggregate and anonymize by default, and document your methodology, including how each category is defined, so year-over-year comparisons stay valid when definitions shift.
Reporting Cadence and Governance
A practical starting cadence is a quarterly operational dashboard for HR and people managers and an annual report for the board or public, adjusted to the organization’s size, data quality, and legal obligations. Quantitative data can refresh continuously; survey data rarely supports more than one or two reads a year.
Assign an owner to every metric, because unowned metrics do not move. Only connect manager scorecards to inclusion outcomes where managers have meaningful influence over the result, and the measure has safeguards against gaming or unfair evaluation.
For each metric, document the action that follows if the result crosses a defined threshold. Publish what you intend to act on.
Transparency without a change plan attached costs more trust than silence.
Common Measurement Mistakes
- Counting training completions and calling it impact.
- Reporting only company-wide averages, which mask every gap.
- Measuring once, with no baseline and no follow-up.
- Chasing one headline number instead of a small, coherent metric set.
- Surveying repeatedly without reporting results back or acting on them.
- Leaving accessibility and disability data out of the frame entirely.
- Publishing a score without naming the owner, decision, or action that follows it.
A 90-Day DEI Measurement Plan
Days 1 to 30. Audit what data you already hold. Select six to eight metrics tied to named decisions. Confirm data sources and system owners, and complete legal and privacy review.
Days 31 to 60. Field an inclusion survey or listening process appropriate to your organization’s size and privacy constraints. Segment historical hiring, promotion, and attrition data by group, level, and location so you have trend lines rather than a single snapshot.
Days 61 to 90. Build the dashboard, brief leadership on the gaps you found, assign an owner and a target to each metric, and put the next review on the calendar before the meeting ends.
DEI Measurement FAQs
Frequently asked questions
What are the most important DEI metrics to track?
How do you measure inclusion beyond representation?
What is the difference between a diversity metric and an inclusion metric?
How do you create a DEI scorecard?
How do you measure disability inclusion within a DEI program?
How do small organizations measure DEI?
How do you measure DEI success without setting quotas?
Turn DEI Measurement Into Action
A scorecard is useful only when it leads to decisions that improve access, opportunity, participation, and lived experience. If your organization needs help connecting DEI measurement with accessibility, policy, strategy, or implementation, explore the Foundation’s measurable inclusion advisory services or contact the Foundation.